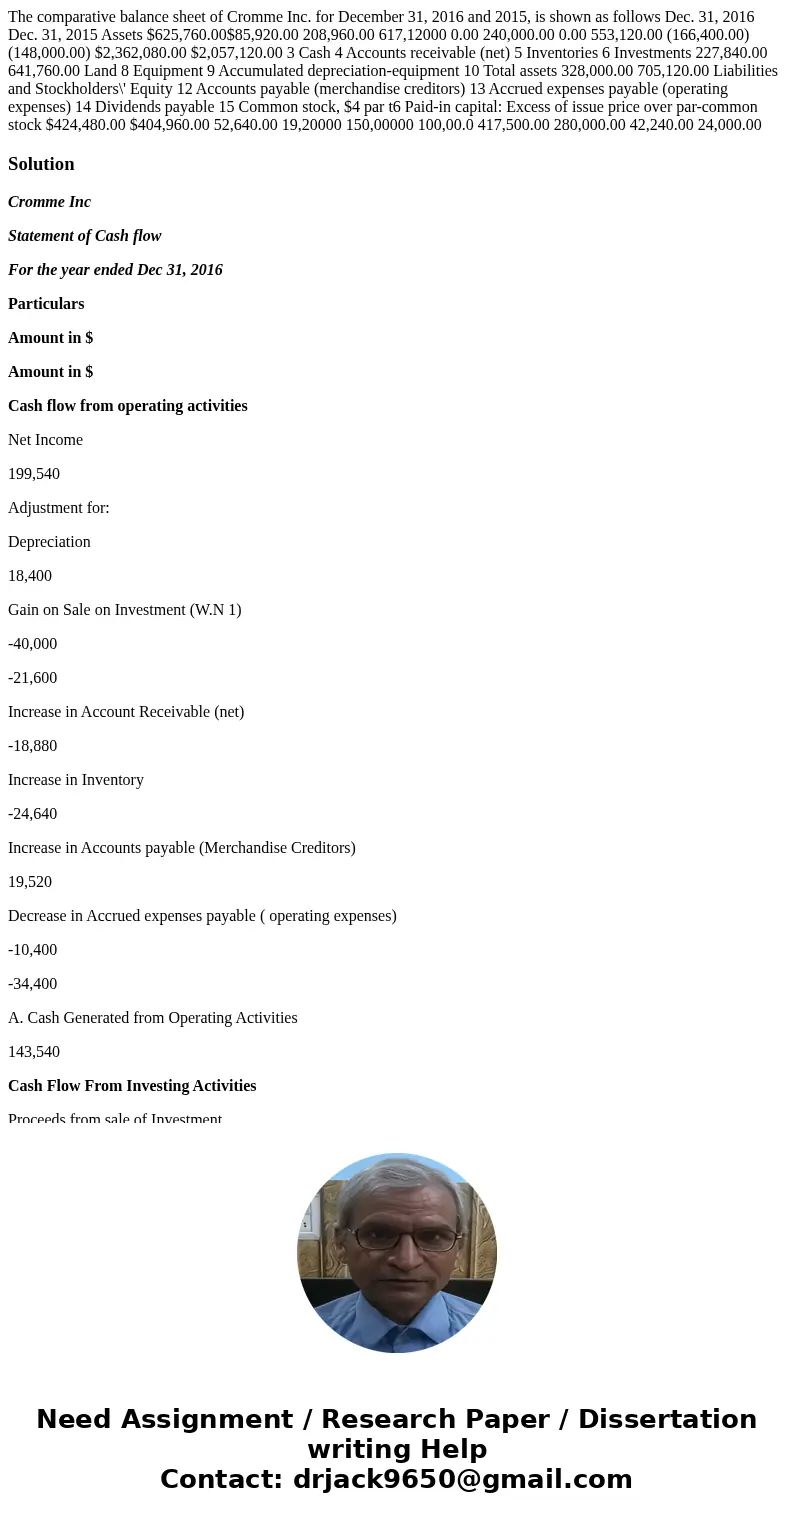
The comparative balance sheet of Cromme Inc for December 31
Solution
Cromme Inc
Statement of Cash flow
For the year ended Dec 31, 2016
Particulars
Amount in $
Amount in $
Cash flow from operating activities
Net Income
199,540
Adjustment for:
Depreciation
18,400
Gain on Sale on Investment (W.N 1)
-40,000
-21,600
Increase in Account Receivable (net)
-18,880
Increase in Inventory
-24,640
Increase in Accounts payable (Merchandise Creditors)
19,520
Decrease in Accrued expenses payable ( operating expenses)
-10,400
-34,400
A. Cash Generated from Operating Activities
143,540
Cash Flow From Investing Activities
Proceeds from sale of Investment
280,000
Purchase of Land
-328,000
Purchase of Equipment
-152,000
B. Net Cash Used in Investing Activity
-200,000
Cash Flow From Financing Activity
Proceeds from issuance of Common stock
50,000
Proceeds from paid in capital : excess of price over par
137,500
Dividend Paid (W.N 2)
-91,200
C. Net Cash generated from financing activity
96,300
D. Net increase in cash and cash equivalent (A+B+C)
39,840
E. Cash and Cash Equivalent at the beginning of year
585,920
F. Cash and Cash Equivalent at the end of year (D+E)
625,760
W.N.1 (Amount in $)
Proceeds from sale of Investment
280,000
Less : Investment As on Dec 31, 2015
-240,000
Gain/ (Loss) from sale of Investment
40,000
W.N.2 (Amount in $)
Dividend Payable as on Dec 31, 2015
19,200
Add: Dividend Declared
96,000
Less: Dividend Payable as on Dec 31, 2016
-24,000
Cash Dividend paid during the year
91,200
| Particulars | Amount in $ | Amount in $ |
| Cash flow from operating activities | ||
| Net Income | 199,540 | |
| Adjustment for: | ||
| Depreciation | 18,400 | |
| Gain on Sale on Investment (W.N 1) | -40,000 | |
| -21,600 | ||
| Increase in Account Receivable (net) | -18,880 | |
| Increase in Inventory | -24,640 | |
| Increase in Accounts payable (Merchandise Creditors) | 19,520 | |
| Decrease in Accrued expenses payable ( operating expenses) | -10,400 | |
| -34,400 | ||
| A. Cash Generated from Operating Activities | 143,540 | |
| Cash Flow From Investing Activities | ||
| Proceeds from sale of Investment | 280,000 | |
| Purchase of Land | -328,000 | |
| Purchase of Equipment | -152,000 | |
| B. Net Cash Used in Investing Activity | -200,000 | |
| Cash Flow From Financing Activity | ||
| Proceeds from issuance of Common stock | 50,000 | |
| Proceeds from paid in capital : excess of price over par | 137,500 | |
| Dividend Paid (W.N 2) | -91,200 | |
| C. Net Cash generated from financing activity | 96,300 | |
| D. Net increase in cash and cash equivalent (A+B+C) | 39,840 | |
| E. Cash and Cash Equivalent at the beginning of year | 585,920 | |
| F. Cash and Cash Equivalent at the end of year (D+E) | 625,760 |


 Homework Sourse