Purpose Statement and Model 1 In the introductory paragraph
Purpose Statement and Model
1) In the introductory paragraph, state why the dependent variable has been chosen for analysis. Then make a general statement about the model:
“The dependent variable _______ is determined by variables ________, ________, ________, and ________.”
2) In the second paragraph, identify the primary independent variable and defend why it is important.
“The most important variable in this analysis is ________ because _________.” In this paragraph, cite and discuss the two research sources that support the thesis, i.e., the model.
3) Write the general form of the regression model (less intercept and coefficients), with the variables named appropriately so reader can identify each variable at a glance:
Dep_Var = Ind_Var_1 + Ind_Var_2 + Ind_Var_3
For instance, a typical model would be written:
Price_of_Home = Square_Footage + Number_Bedrooms + Lot_Size
Where
Price_of_Home: brief definition of dependent variable
Square_Footage: brief definition of first independent variable
Number_Bedrooms: brief definition of second independent variable
Lot_Size: brief definition of third independent variable
[Note: student of course replaces these variable names with his/her own variable names.]
Definition of Variables
4) Define and defend all variables, including the dependent variable, in a single paragraph for each variable. Also, state the expectations for each independent variable. These paragraphs should be in numerical order, i.e., dependent variable, X1, then X2, etc.
In each paragraph, the following should be addressed:
How is the variable defined in the data source?
Which unit of measurement is used?
For the independent variables: why does the variable determine Y?
What sign is expected for the independent variable\'s coefficient, positive or negative? Why?
Data Description
5) In one paragraph, describe the data and identify the data sources.
From which general sources and from which specific tables are the data taken? (Citing a website is not acceptable.)
Which year or years were the data collected?
Are there any data limitations?
Presentation and Interpretation of Results
6) Write the regression (prediction) equation:
Dep_Var = Intercept + c1 * Ind_Var_1 + c2 * Ind_Var_2 + c3* Ind_Var_3
7) Identify and interpret the adjusted R2 (one paragraph):
Define “adjusted R2.”
What does the value of the adjusted R2 reveal about the model?
If the adjusted R2 is low, how has the choice of independent variables created this result?
8) Identify and interpret the F test (one paragraph):
Using the p-value approach, is the null hypothesis for the F test rejected or not rejected? Why or why not?
Interpret the implications of these findings for the model.
9) Identify and interpret the t tests for each of the coefficients (one separate paragraph for each variable, in numerical order):
Are the signs of the coefficients as expected? If not, why not?
For each of the coefficients, interpret the numerical value.
Using the p-value approach, is the null hypothesis for the t test rejected or not rejected for each coefficient? Why or why not?
Interpret the implications of these findings for the variable.
Identify the variable with the greatest significance.
10) Analyze multicollinearity of the independent variables (one paragraph):
Generate the correlation matrix.
Define multicollinearity.
Are any of the independent variables highly correlated with each other? If so, identify the variables and explain why they are correlated.
State the implications of multicollinearity (if found) for the model.
11) Other (not required):
If any additional techniques for improving results are employed, discuss these at the end of the paper
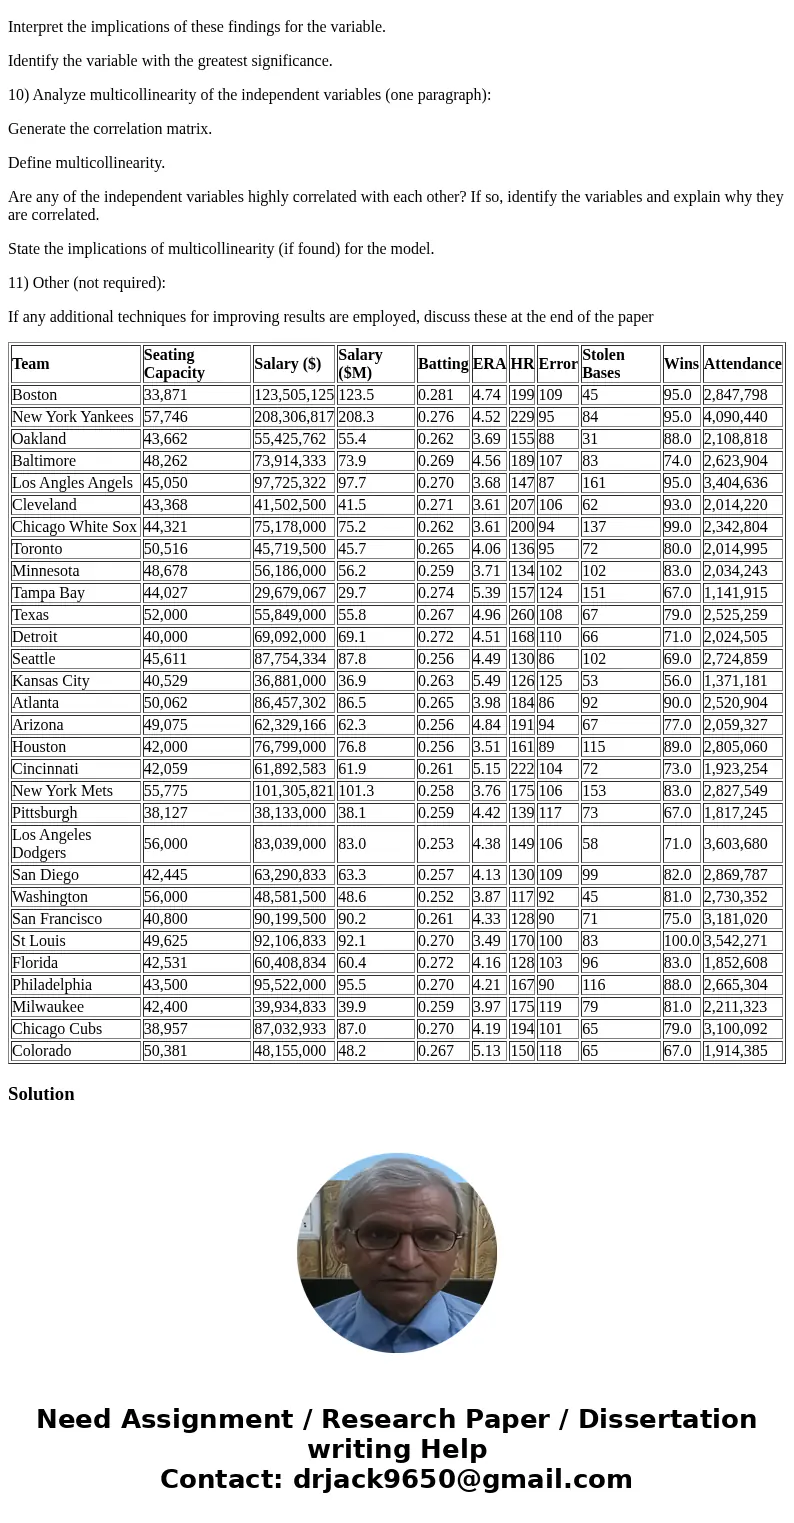
| Team | Seating Capacity | Salary ($) | Salary ($M) | Batting | ERA | HR | Error | Stolen Bases | Wins | Attendance |
| Boston | 33,871 | 123,505,125 | 123.5 | 0.281 | 4.74 | 199 | 109 | 45 | 95.0 | 2,847,798 |
| New York Yankees | 57,746 | 208,306,817 | 208.3 | 0.276 | 4.52 | 229 | 95 | 84 | 95.0 | 4,090,440 |
| Oakland | 43,662 | 55,425,762 | 55.4 | 0.262 | 3.69 | 155 | 88 | 31 | 88.0 | 2,108,818 |
| Baltimore | 48,262 | 73,914,333 | 73.9 | 0.269 | 4.56 | 189 | 107 | 83 | 74.0 | 2,623,904 |
| Los Angles Angels | 45,050 | 97,725,322 | 97.7 | 0.270 | 3.68 | 147 | 87 | 161 | 95.0 | 3,404,636 |
| Cleveland | 43,368 | 41,502,500 | 41.5 | 0.271 | 3.61 | 207 | 106 | 62 | 93.0 | 2,014,220 |
| Chicago White Sox | 44,321 | 75,178,000 | 75.2 | 0.262 | 3.61 | 200 | 94 | 137 | 99.0 | 2,342,804 |
| Toronto | 50,516 | 45,719,500 | 45.7 | 0.265 | 4.06 | 136 | 95 | 72 | 80.0 | 2,014,995 |
| Minnesota | 48,678 | 56,186,000 | 56.2 | 0.259 | 3.71 | 134 | 102 | 102 | 83.0 | 2,034,243 |
| Tampa Bay | 44,027 | 29,679,067 | 29.7 | 0.274 | 5.39 | 157 | 124 | 151 | 67.0 | 1,141,915 |
| Texas | 52,000 | 55,849,000 | 55.8 | 0.267 | 4.96 | 260 | 108 | 67 | 79.0 | 2,525,259 |
| Detroit | 40,000 | 69,092,000 | 69.1 | 0.272 | 4.51 | 168 | 110 | 66 | 71.0 | 2,024,505 |
| Seattle | 45,611 | 87,754,334 | 87.8 | 0.256 | 4.49 | 130 | 86 | 102 | 69.0 | 2,724,859 |
| Kansas City | 40,529 | 36,881,000 | 36.9 | 0.263 | 5.49 | 126 | 125 | 53 | 56.0 | 1,371,181 |
| Atlanta | 50,062 | 86,457,302 | 86.5 | 0.265 | 3.98 | 184 | 86 | 92 | 90.0 | 2,520,904 |
| Arizona | 49,075 | 62,329,166 | 62.3 | 0.256 | 4.84 | 191 | 94 | 67 | 77.0 | 2,059,327 |
| Houston | 42,000 | 76,799,000 | 76.8 | 0.256 | 3.51 | 161 | 89 | 115 | 89.0 | 2,805,060 |
| Cincinnati | 42,059 | 61,892,583 | 61.9 | 0.261 | 5.15 | 222 | 104 | 72 | 73.0 | 1,923,254 |
| New York Mets | 55,775 | 101,305,821 | 101.3 | 0.258 | 3.76 | 175 | 106 | 153 | 83.0 | 2,827,549 |
| Pittsburgh | 38,127 | 38,133,000 | 38.1 | 0.259 | 4.42 | 139 | 117 | 73 | 67.0 | 1,817,245 |
| Los Angeles Dodgers | 56,000 | 83,039,000 | 83.0 | 0.253 | 4.38 | 149 | 106 | 58 | 71.0 | 3,603,680 |
| San Diego | 42,445 | 63,290,833 | 63.3 | 0.257 | 4.13 | 130 | 109 | 99 | 82.0 | 2,869,787 |
| Washington | 56,000 | 48,581,500 | 48.6 | 0.252 | 3.87 | 117 | 92 | 45 | 81.0 | 2,730,352 |
| San Francisco | 40,800 | 90,199,500 | 90.2 | 0.261 | 4.33 | 128 | 90 | 71 | 75.0 | 3,181,020 |
| St Louis | 49,625 | 92,106,833 | 92.1 | 0.270 | 3.49 | 170 | 100 | 83 | 100.0 | 3,542,271 |
| Florida | 42,531 | 60,408,834 | 60.4 | 0.272 | 4.16 | 128 | 103 | 96 | 83.0 | 1,852,608 |
| Philadelphia | 43,500 | 95,522,000 | 95.5 | 0.270 | 4.21 | 167 | 90 | 116 | 88.0 | 2,665,304 |
| Milwaukee | 42,400 | 39,934,833 | 39.9 | 0.259 | 3.97 | 175 | 119 | 79 | 81.0 | 2,211,323 |
| Chicago Cubs | 38,957 | 87,032,933 | 87.0 | 0.270 | 4.19 | 194 | 101 | 65 | 79.0 | 3,100,092 |
| Colorado | 50,381 | 48,155,000 | 48.2 | 0.267 | 5.13 | 150 | 118 | 65 | 67.0 | 1,914,385 |
Solution


 Homework Sourse