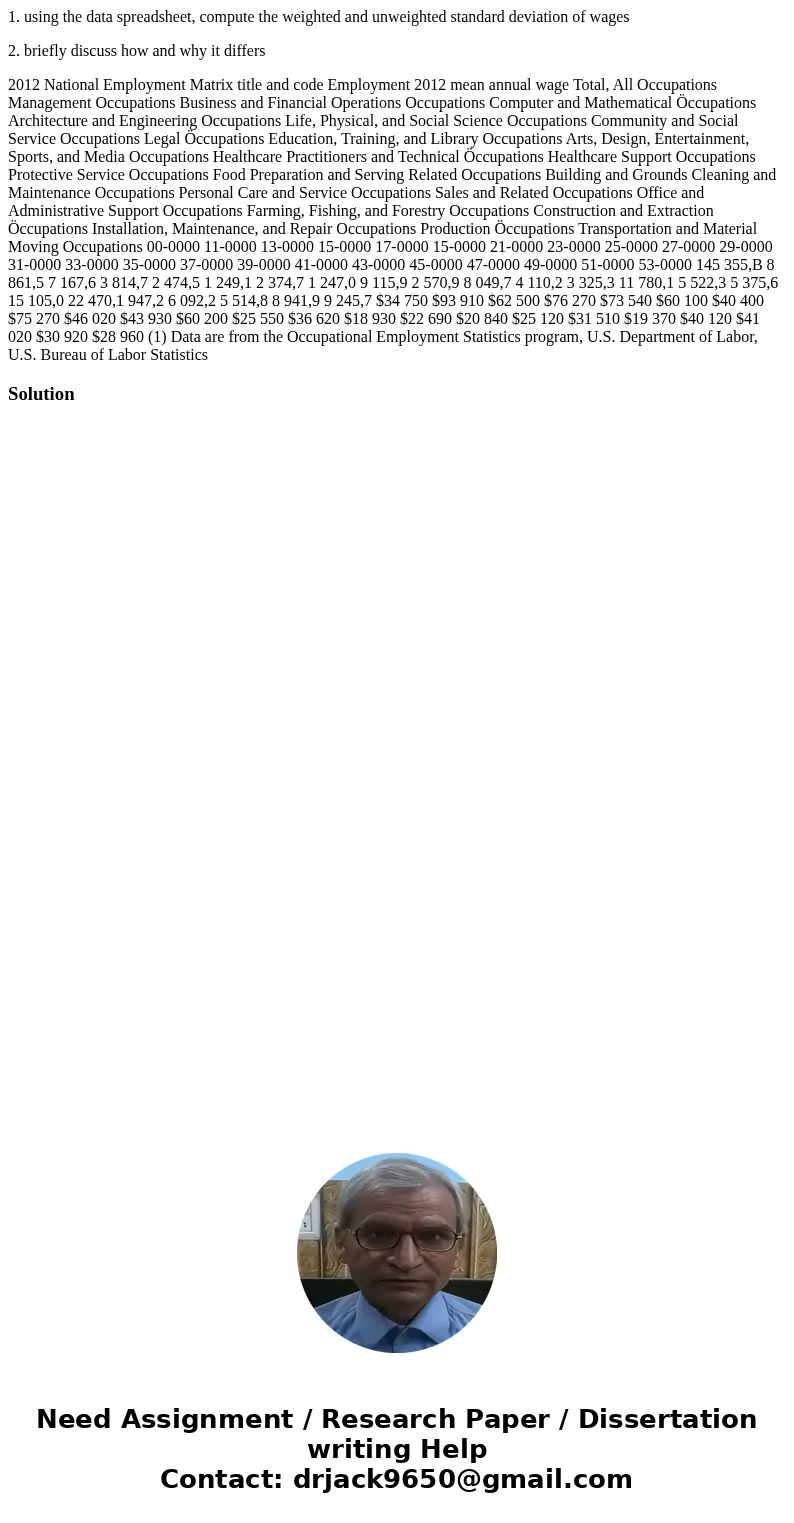
1 using the data spreadsheet compute the weighted and unweig
1. using the data spreadsheet, compute the weighted and unweighted standard deviation of wages
2. briefly discuss how and why it differs
2012 National Employment Matrix title and code Employment 2012 mean annual wage Total, All Occupations Management Occupations Business and Financial Operations Occupations Computer and Mathematical Öccupations Architecture and Engineering Occupations Life, Physical, and Social Science Occupations Community and Social Service Occupations Legal Öccupations Education, Training, and Library Occupations Arts, Design, Entertainment, Sports, and Media Occupations Healthcare Practitioners and Technical Öccupations Healthcare Support Occupations Protective Service Occupations Food Preparation and Serving Related Occupations Building and Grounds Cleaning and Maintenance Occupations Personal Care and Service Occupations Sales and Related Occupations Office and Administrative Support Occupations Farming, Fishing, and Forestry Occupations Construction and Extraction Öccupations Installation, Maintenance, and Repair Occupations Production Öccupations Transportation and Material Moving Occupations 00-0000 11-0000 13-0000 15-0000 17-0000 15-0000 21-0000 23-0000 25-0000 27-0000 29-0000 31-0000 33-0000 35-0000 37-0000 39-0000 41-0000 43-0000 45-0000 47-0000 49-0000 51-0000 53-0000 145 355,B 8 861,5 7 167,6 3 814,7 2 474,5 1 249,1 2 374,7 1 247,0 9 115,9 2 570,9 8 049,7 4 110,2 3 325,3 11 780,1 5 522,3 5 375,6 15 105,0 22 470,1 947,2 6 092,2 5 514,8 8 941,9 9 245,7 $34 750 $93 910 $62 500 $76 270 $73 540 $60 100 $40 400 $75 270 $46 020 $43 930 $60 200 $25 550 $36 620 $18 930 $22 690 $20 840 $25 120 $31 510 $19 370 $40 120 $41 020 $30 920 $28 960 (1) Data are from the Occupational Employment Statistics program, U.S. Department of Labor, U.S. Bureau of Labor StatisticsSolution

 Homework Sourse