5 You would like to show how the number of faculty at the en
5.
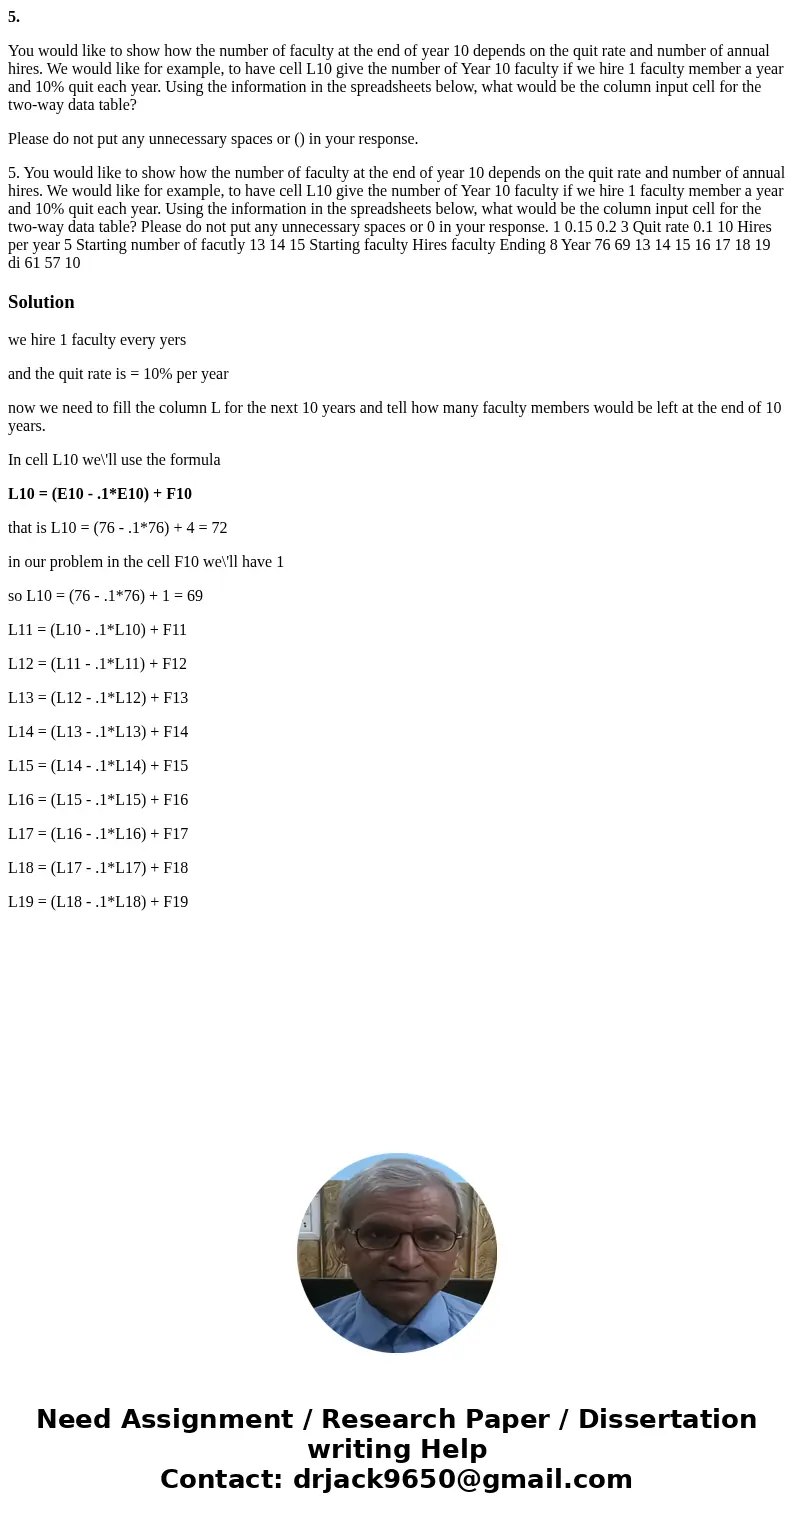
You would like to show how the number of faculty at the end of year 10 depends on the quit rate and number of annual hires. We would like for example, to have cell L10 give the number of Year 10 faculty if we hire 1 faculty member a year and 10% quit each year. Using the information in the spreadsheets below, what would be the column input cell for the two-way data table?
Please do not put any unnecessary spaces or () in your response.
5. You would like to show how the number of faculty at the end of year 10 depends on the quit rate and number of annual hires. We would like for example, to have cell L10 give the number of Year 10 faculty if we hire 1 faculty member a year and 10% quit each year. Using the information in the spreadsheets below, what would be the column input cell for the two-way data table? Please do not put any unnecessary spaces or 0 in your response. 1 0.15 0.2 3 Quit rate 0.1 10 Hires per year 5 Starting number of facutly 13 14 15 Starting faculty Hires faculty Ending 8 Year 76 69 13 14 15 16 17 18 19 di 61 57 10Solution
we hire 1 faculty every yers
and the quit rate is = 10% per year
now we need to fill the column L for the next 10 years and tell how many faculty members would be left at the end of 10 years.
In cell L10 we\'ll use the formula
L10 = (E10 - .1*E10) + F10
that is L10 = (76 - .1*76) + 4 = 72
in our problem in the cell F10 we\'ll have 1
so L10 = (76 - .1*76) + 1 = 69
L11 = (L10 - .1*L10) + F11
L12 = (L11 - .1*L11) + F12
L13 = (L12 - .1*L12) + F13
L14 = (L13 - .1*L13) + F14
L15 = (L14 - .1*L14) + F15
L16 = (L15 - .1*L15) + F16
L17 = (L16 - .1*L16) + F17
L18 = (L17 - .1*L17) + F18
L19 = (L18 - .1*L18) + F19

 Homework Sourse