Explain the significance of each graph TGF ingmL Filrilin1 A
Solution
Answer:
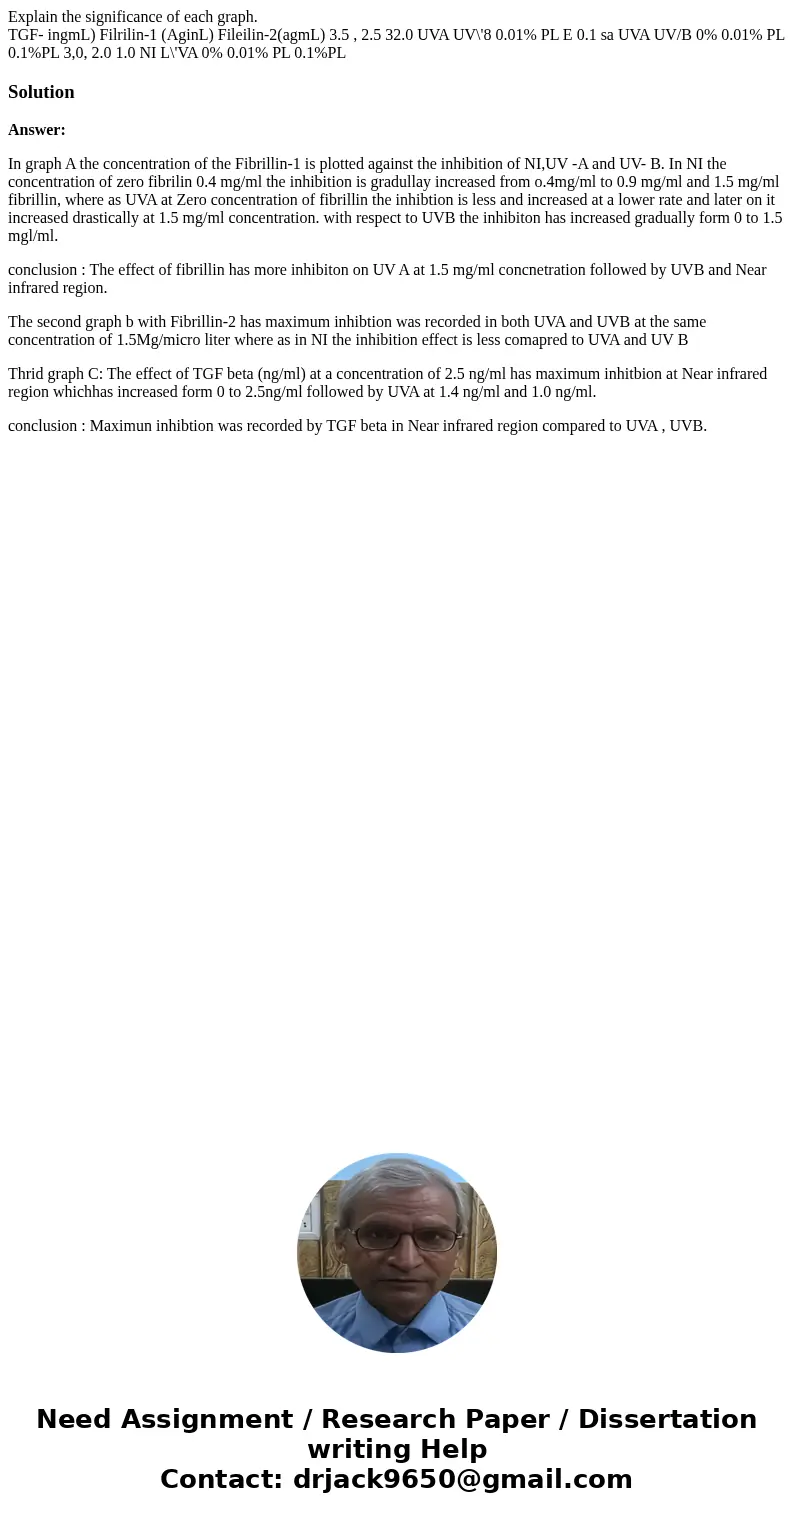
In graph A the concentration of the Fibrillin-1 is plotted against the inhibition of NI,UV -A and UV- B. In NI the concentration of zero fibrilin 0.4 mg/ml the inhibition is gradullay increased from o.4mg/ml to 0.9 mg/ml and 1.5 mg/ml fibrillin, where as UVA at Zero concentration of fibrillin the inhibtion is less and increased at a lower rate and later on it increased drastically at 1.5 mg/ml concentration. with respect to UVB the inhibiton has increased gradually form 0 to 1.5 mgl/ml.
conclusion : The effect of fibrillin has more inhibiton on UV A at 1.5 mg/ml concnetration followed by UVB and Near infrared region.
The second graph b with Fibrillin-2 has maximum inhibtion was recorded in both UVA and UVB at the same concentration of 1.5Mg/micro liter where as in NI the inhibition effect is less comapred to UVA and UV B
Thrid graph C: The effect of TGF beta (ng/ml) at a concentration of 2.5 ng/ml has maximum inhitbion at Near infrared region whichhas increased form 0 to 2.5ng/ml followed by UVA at 1.4 ng/ml and 1.0 ng/ml.
conclusion : Maximun inhibtion was recorded by TGF beta in Near infrared region compared to UVA , UVB.

 Homework Sourse