The table below shows the ANOVA summary for a study examinin
The table below shows the ANOVA summary for a study examining whether there is an effect of teaching method (Factor A, online or traditional teaching) and/or subject (Factor B, mathematics or social studies) on test scores.
Online
Traditional
Fobs significance
Math
85
95
Factor A (teaching method) p<0.05
Factor B (subject) p<0.05
Interaction AxB p<0.05
Tukey CD = 4
Social Studies
87
86
Show all needed work. Is there a significant interaction between Factors A and B?
| Online | Traditional | Fobs significance | |
| Math | 85 | 95 | Factor A (teaching method) p<0.05 Factor B (subject) p<0.05 Interaction AxB p<0.05 Tukey CD = 4 |
| Social Studies | 87 | 86 |
Solution
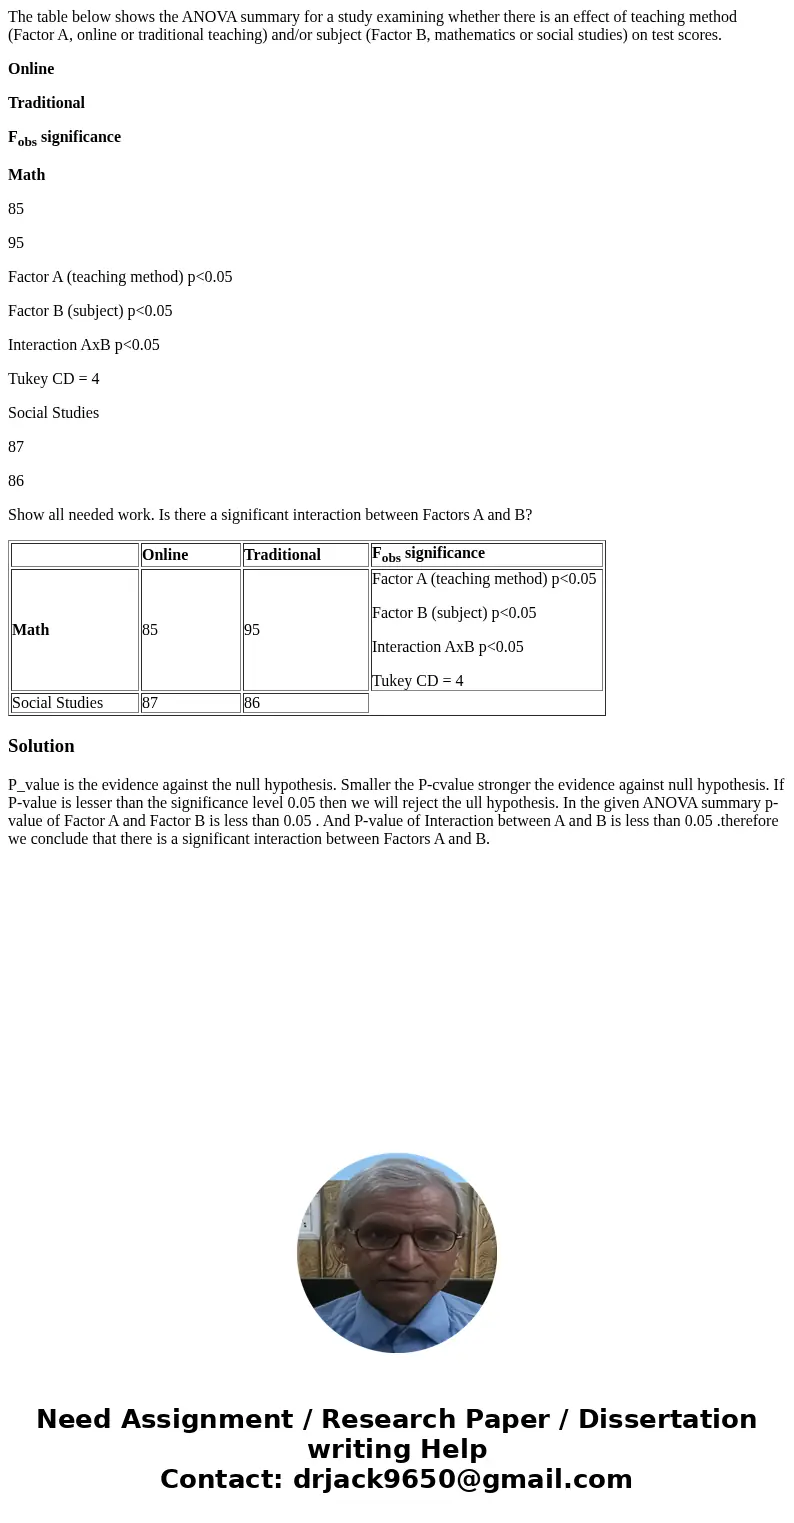
P_value is the evidence against the null hypothesis. Smaller the P-cvalue stronger the evidence against null hypothesis. If P-value is lesser than the significance level 0.05 then we will reject the ull hypothesis. In the given ANOVA summary p-value of Factor A and Factor B is less than 0.05 . And P-value of Interaction between A and B is less than 0.05 .therefore we conclude that there is a significant interaction between Factors A and B.

 Homework Sourse