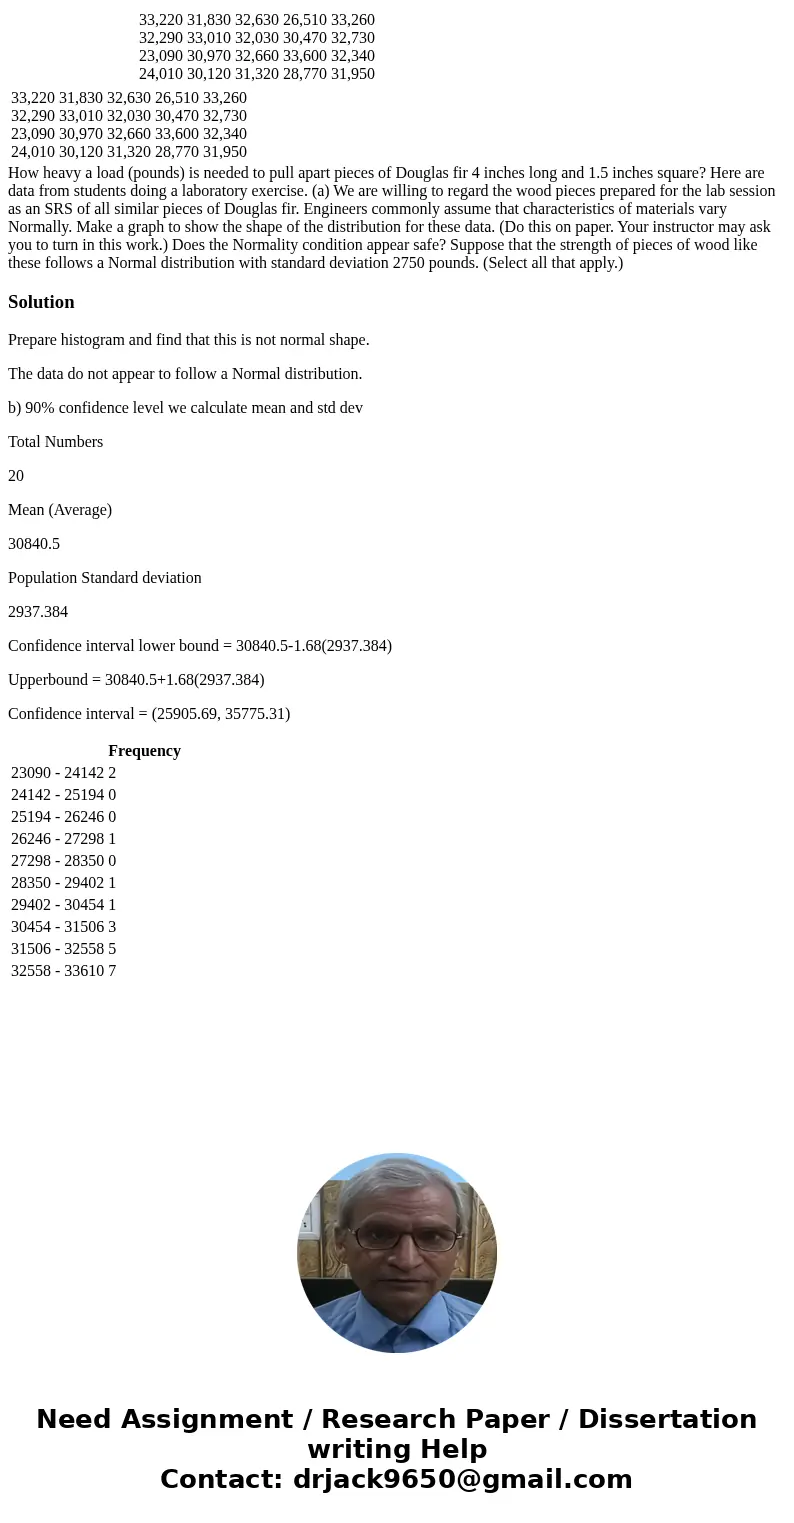
33220 32290 23090 24010 31830 33010 30970 30120 32630 32030
| 33,220 32,290 23,090 24,010 | 31,830 33,010 30,970 30,120 | 32,630 32,030 32,660 31,320 | 26,510 30,470 33,600 28,770 | 33,260 32,730 32,340 31,950 |
| 33,220 32,290 23,090 24,010 | 31,830 33,010 30,970 30,120 | 32,630 32,030 32,660 31,320 | 26,510 30,470 33,600 28,770 | 33,260 32,730 32,340 31,950 |
Solution
Prepare histogram and find that this is not normal shape.
The data do not appear to follow a Normal distribution.
b) 90% confidence level we calculate mean and std dev
Total Numbers
20
Mean (Average)
30840.5
Population Standard deviation
2937.384
Confidence interval lower bound = 30840.5-1.68(2937.384)
Upperbound = 30840.5+1.68(2937.384)
Confidence interval = (25905.69, 35775.31)
| Frequency | |
|---|---|
| 23090 - 24142 | 2 |
| 24142 - 25194 | 0 |
| 25194 - 26246 | 0 |
| 26246 - 27298 | 1 |
| 27298 - 28350 | 0 |
| 28350 - 29402 | 1 |
| 29402 - 30454 | 1 |
| 30454 - 31506 | 3 |
| 31506 - 32558 | 5 |
| 32558 - 33610 | 7 |

 Homework Sourse