The management of a regional bus line thought the companys c
The management of a regional bus line thought the company’s cost of gas might be correlated with its passenger/mile ratio. The data and a correlation matrix follows. Comment.
Year Average Wholesale Cost of Gas Passengers/Miles
1 56.5 8.37
2 59.4 8.93
3 63.0 9.15
4 65.6 9.79
5 89.0 11.20
Year Price Mile
Year (r) 1,00000 0.87016 0.951227
p-value 0.00000 0.05510 0.01280
Price (r) 0.877016 1,00000 0.97309
p-value 0.05510 0.00000 0.00530
Mile(r) 0.95127 0.97309 1.00000
p-value 0.01280 0.00530 0.00000
How do I comment or solve this problem? Please!
Solution
pvalue
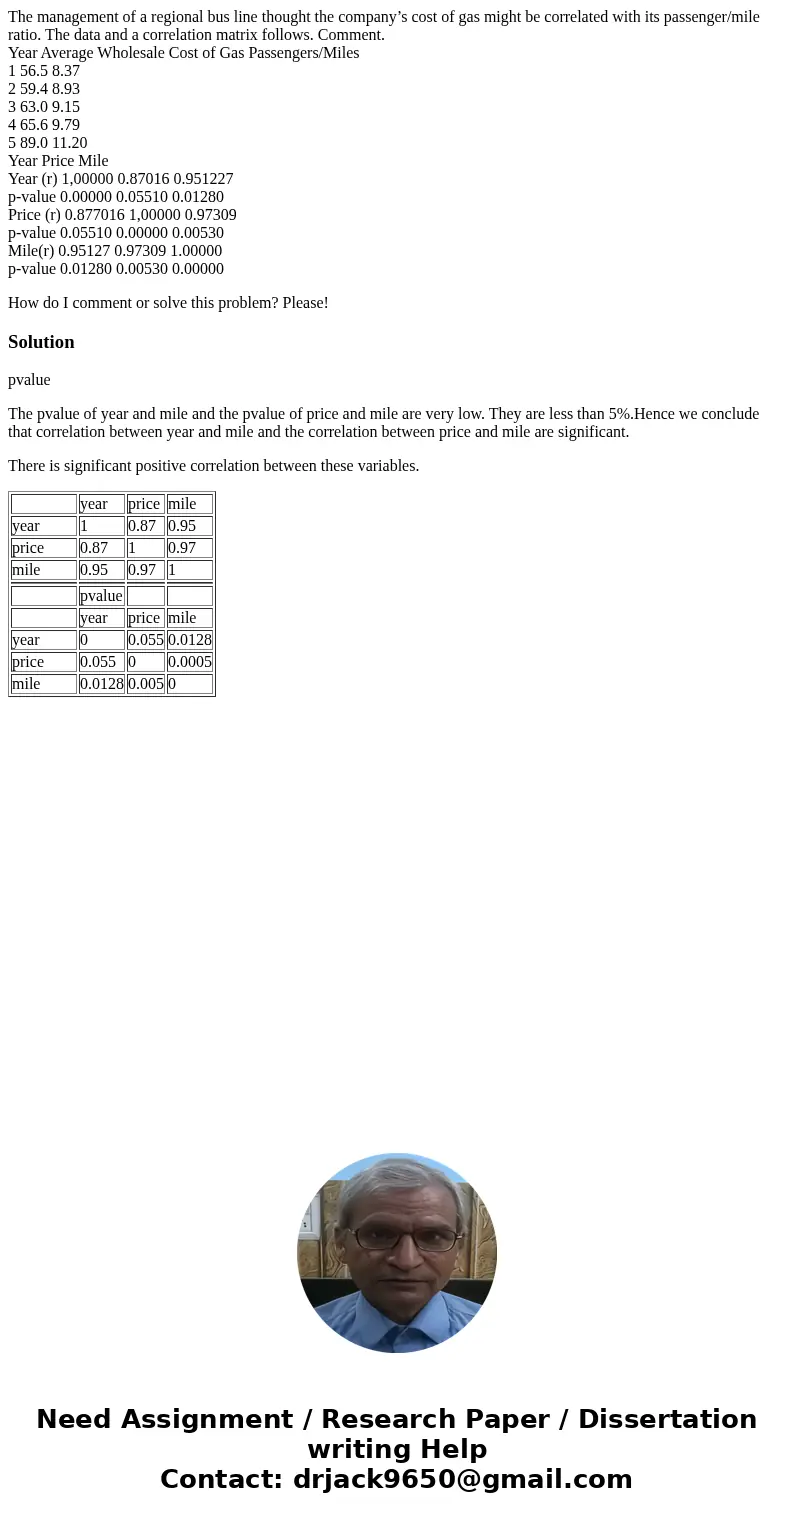
The pvalue of year and mile and the pvalue of price and mile are very low. They are less than 5%.Hence we conclude that correlation between year and mile and the correlation between price and mile are significant.
There is significant positive correlation between these variables.
| year | price | mile | |
| year | 1 | 0.87 | 0.95 |
| price | 0.87 | 1 | 0.97 |
| mile | 0.95 | 0.97 | 1 |
| pvalue | |||
| year | price | mile | |
| year | 0 | 0.055 | 0.0128 |
| price | 0.055 | 0 | 0.0005 |
| mile | 0.0128 | 0.005 | 0 |

 Homework Sourse