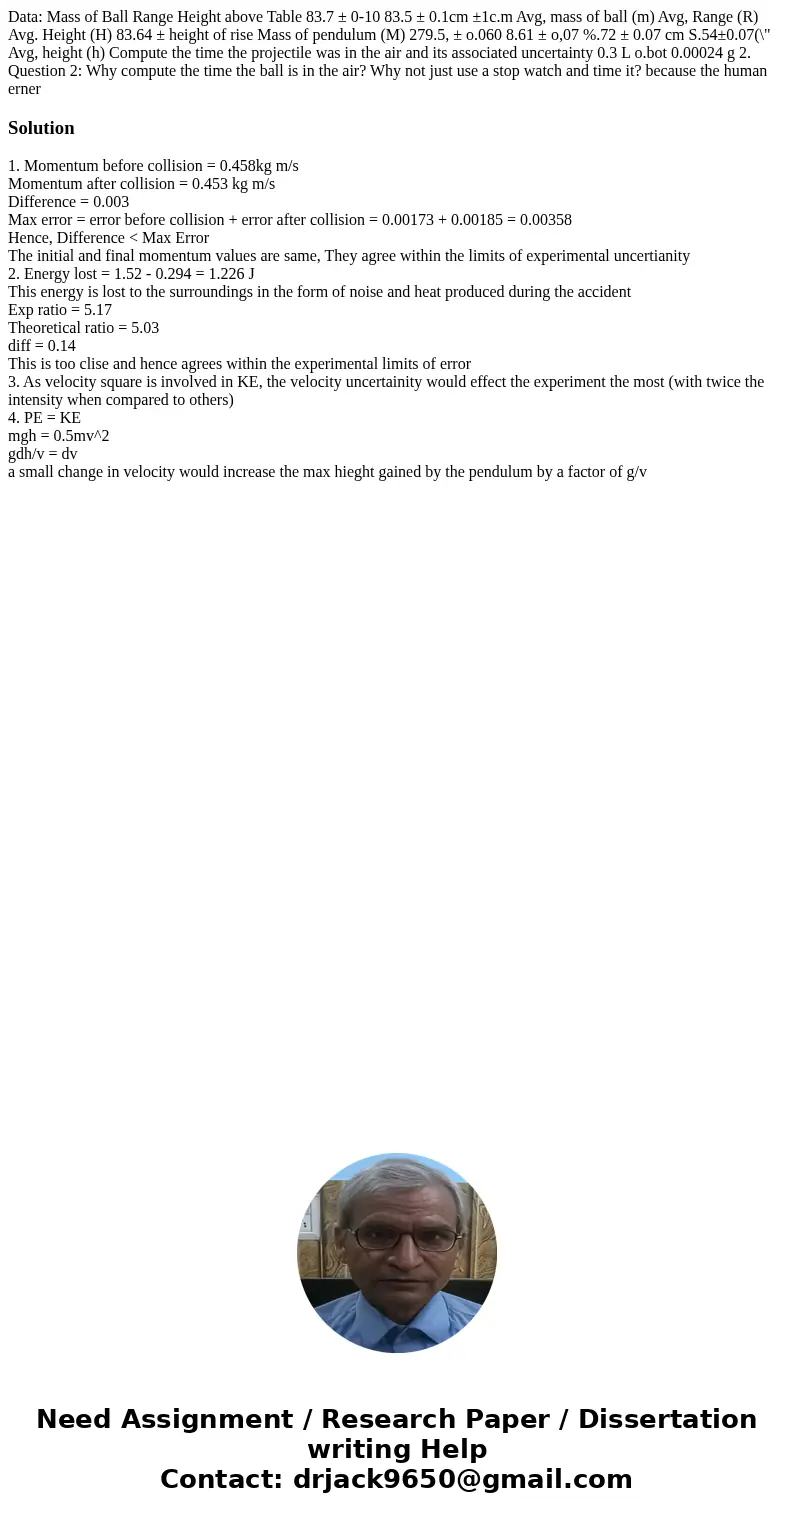
Data Mass of Ball Range Height above Table 837 010 835 01c
Solution
1. Momentum before collision = 0.458kg m/s
Momentum after collision = 0.453 kg m/s
Difference = 0.003
Max error = error before collision + error after collision = 0.00173 + 0.00185 = 0.00358
Hence, Difference < Max Error
The initial and final momentum values are same, They agree within the limits of experimental uncertianity
2. Energy lost = 1.52 - 0.294 = 1.226 J
This energy is lost to the surroundings in the form of noise and heat produced during the accident
Exp ratio = 5.17
Theoretical ratio = 5.03
diff = 0.14
This is too clise and hence agrees within the experimental limits of error
3. As velocity square is involved in KE, the velocity uncertainity would effect the experiment the most (with twice the intensity when compared to others)
4. PE = KE
mgh = 0.5mv^2
gdh/v = dv
a small change in velocity would increase the max hieght gained by the pendulum by a factor of g/v

 Homework Sourse