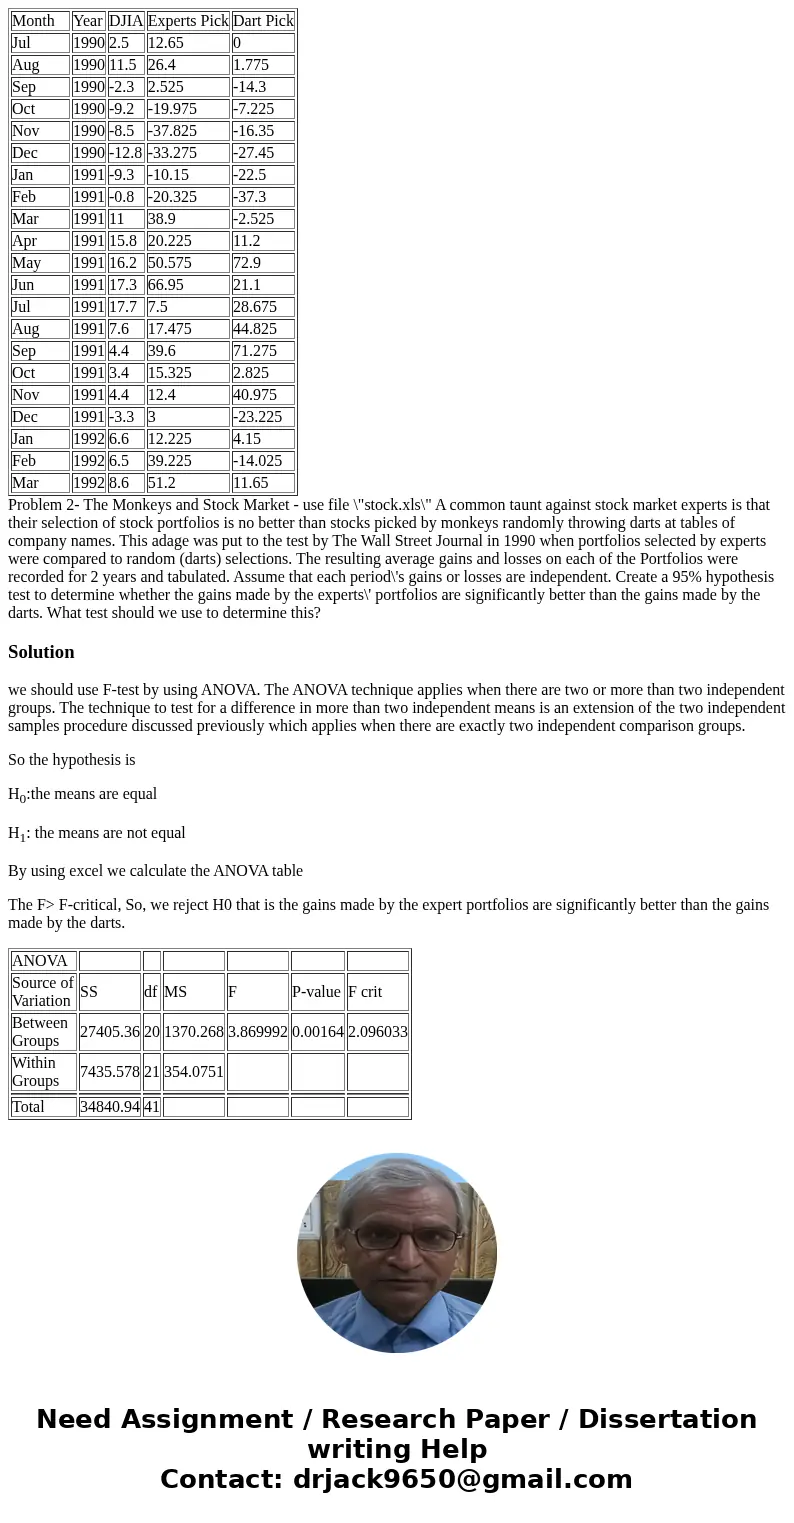
Month Year DJIA Experts Pick Dart Pick Jul 1990 25 1265 0 Au
| Month | Year | DJIA | Experts Pick | Dart Pick |
| Jul | 1990 | 2.5 | 12.65 | 0 |
| Aug | 1990 | 11.5 | 26.4 | 1.775 |
| Sep | 1990 | -2.3 | 2.525 | -14.3 |
| Oct | 1990 | -9.2 | -19.975 | -7.225 |
| Nov | 1990 | -8.5 | -37.825 | -16.35 |
| Dec | 1990 | -12.8 | -33.275 | -27.45 |
| Jan | 1991 | -9.3 | -10.15 | -22.5 |
| Feb | 1991 | -0.8 | -20.325 | -37.3 |
| Mar | 1991 | 11 | 38.9 | -2.525 |
| Apr | 1991 | 15.8 | 20.225 | 11.2 |
| May | 1991 | 16.2 | 50.575 | 72.9 |
| Jun | 1991 | 17.3 | 66.95 | 21.1 |
| Jul | 1991 | 17.7 | 7.5 | 28.675 |
| Aug | 1991 | 7.6 | 17.475 | 44.825 |
| Sep | 1991 | 4.4 | 39.6 | 71.275 |
| Oct | 1991 | 3.4 | 15.325 | 2.825 |
| Nov | 1991 | 4.4 | 12.4 | 40.975 |
| Dec | 1991 | -3.3 | 3 | -23.225 |
| Jan | 1992 | 6.6 | 12.225 | 4.15 |
| Feb | 1992 | 6.5 | 39.225 | -14.025 |
| Mar | 1992 | 8.6 | 51.2 | 11.65 |
Solution
we should use F-test by using ANOVA. The ANOVA technique applies when there are two or more than two independent groups. The technique to test for a difference in more than two independent means is an extension of the two independent samples procedure discussed previously which applies when there are exactly two independent comparison groups.
So the hypothesis is
H0:the means are equal
H1: the means are not equal
By using excel we calculate the ANOVA table
The F> F-critical, So, we reject H0 that is the gains made by the expert portfolios are significantly better than the gains made by the darts.
| ANOVA | ||||||
| Source of Variation | SS | df | MS | F | P-value | F crit |
| Between Groups | 27405.36 | 20 | 1370.268 | 3.869992 | 0.00164 | 2.096033 |
| Within Groups | 7435.578 | 21 | 354.0751 | |||
| Total | 34840.94 | 41 |

 Homework Sourse