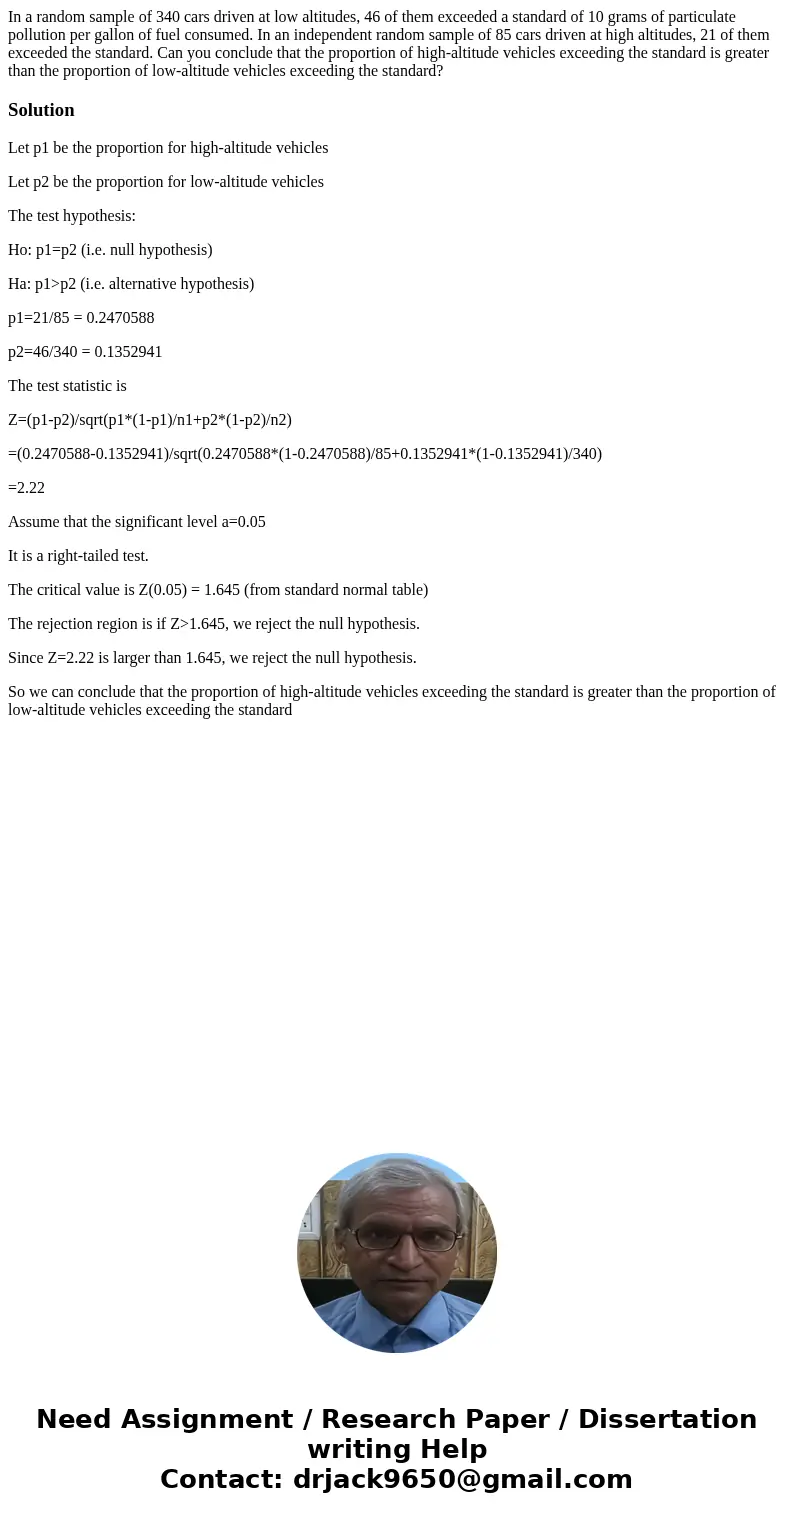
In a random sample of 340 cars driven at low altitudes 46 of
Solution
Let p1 be the proportion for high-altitude vehicles
Let p2 be the proportion for low-altitude vehicles
The test hypothesis:
Ho: p1=p2 (i.e. null hypothesis)
Ha: p1>p2 (i.e. alternative hypothesis)
p1=21/85 = 0.2470588
p2=46/340 = 0.1352941
The test statistic is
Z=(p1-p2)/sqrt(p1*(1-p1)/n1+p2*(1-p2)/n2)
=(0.2470588-0.1352941)/sqrt(0.2470588*(1-0.2470588)/85+0.1352941*(1-0.1352941)/340)
=2.22
Assume that the significant level a=0.05
It is a right-tailed test.
The critical value is Z(0.05) = 1.645 (from standard normal table)
The rejection region is if Z>1.645, we reject the null hypothesis.
Since Z=2.22 is larger than 1.645, we reject the null hypothesis.
So we can conclude that the proportion of high-altitude vehicles exceeding the standard is greater than the proportion of low-altitude vehicles exceeding the standard

 Homework Sourse